
How To Spot Weak Markets
Utilizing distributions is key to knowing which markets you should be attacking.

In the last article, we talked about the concept of range of outcomes/distributions, and how utilizing them provides a more complete picture of evaluating lines. In this article, we’ll go over how that actually looks in practice.
Let’s look at an example of a common scenario you’ll find when evaluating prop markets. Here are some prices for Mo Bamba’s rebounds for the 12/8 Magic-Kings game:
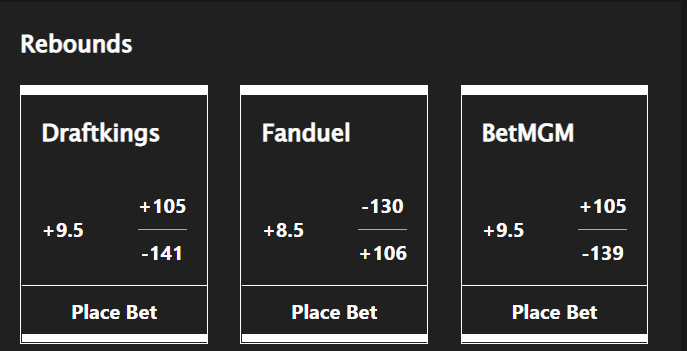
Let’s say you’re operating off a simple rule: the line that most sportsbooks agree with represents the sharp consensus, and any line that’s significantly different than consensus represents a betting opportunity. Here, we see some consensus between Draftkings and MGM on their lines, but Fanduel’s over/under number is lower than the consensus, although with different pricing on both sides of the number. Since the number is lower on Fanduel than the other books, it stands to reason the over might be a good bet. How can we evaluate if this is the case?
First, let’s convert our sharp consensus line to a distribution. The vig-free probabilities for the over/under of 9.5 rebounds implied by the sharp consensus line are 54.4% under 9.5 rebounds, 45.6% over 9.5 rebounds. You can work to find a distribution that satisfies those conditions; we can think of it as our “sharp” distribution. Here’s what one such sharp distribution might look like:
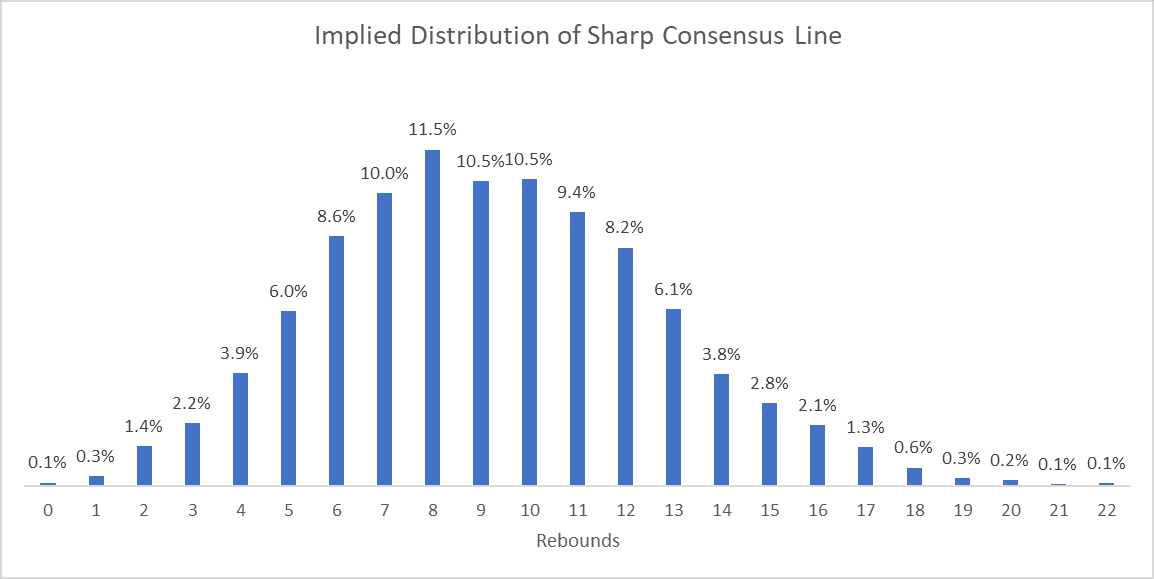
If we believe that distribution to be our best estimate of the true line, we can calculate the expected value of both sides of the Fanduel bet by adding up all of the columns higher and lower than 8.5. The sharp distribution implies a probability of 56.0% over 8.5 rebounds, 44.0% under 8.5 rebounds. The expected value of an over bet on Fanduel with its prices is as follows:
(56%) * (10/13) - (44%) * 1 = -0.9%
This is still a better return than the -6.6% EV of a bet at Draftkings or MGM, but it is still a negative expectation bet and therefore not a good one. Now, let’s repeat the same scenario with another prop line, Spencer Dinwiddie’s rebounds prop from the 12/8 Wizards-Pistons game:
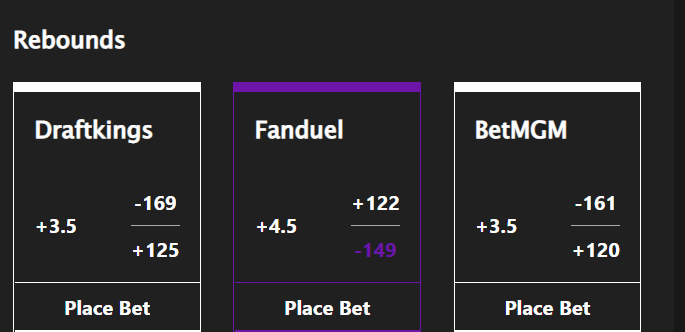
Again, assuming the Draftkings/MGM consensus line is the sharp consensus, here’s what we can assume our sharp distribution to be, one that satisfies the average line between the two:
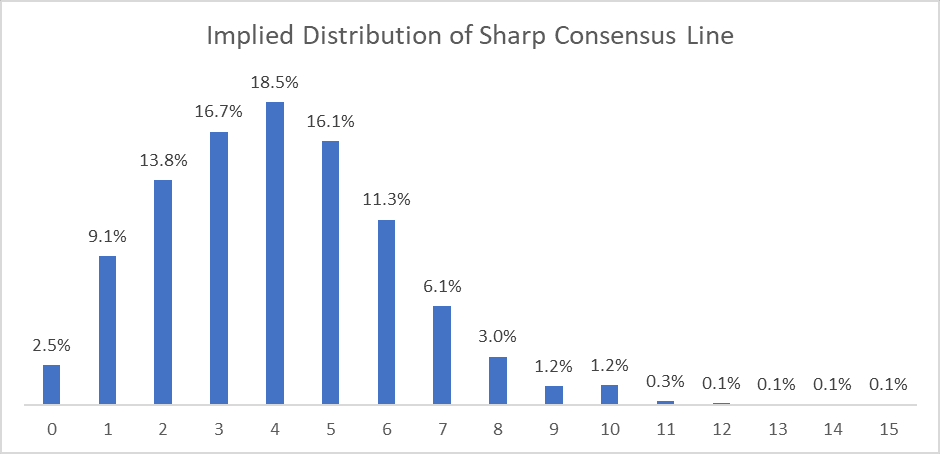
Using the same methodology as above, we can calculate the expected value of the under on the Fanduel prop by summing all the bars under 5 from this distribution and use it to calculate the expected value of betting the over:
(60.6%) * (100/149) - (39.4%) * 1 = +1.2%
In this case, the under on Fanduel is expected to return a 1.2% profit, assuming our sharp distribution is correct.
This illustrates the level of detail required to identify profitable lines in prop markets (and really every market- spreads/totals, alt lines, etc.). It’s not just a question of what is the over/under number on each prop, but also depends heavily on the prices you get on each side, as well as the full range of outcomes you ascribe to each market. Using this process on a daily basis manually is pretty impractical in a vacuum, especially when you factor in how fast the odds can change in many of these markets. The good news is a lot of this process can be automated and packaged into tools, like Unabated’s alternate line calculator, that do the heavy lifting for you, saving a lot of time and effort.
And well-constructed tools like these are not only a matter of convenience, they’re a matter of profitability as well. There are plenty of sports betting sites and tools out there that also calculate expected values of bets in similar markets that don’t go through this full process, opting for rules of thumb and shortcuts, because doing the expected value calculations the right way is hard. These tools may look great on the outside since they can appear to surface winning bets, but I would bet a lot of money that if you tracked their results over the long term, their actual ROI will be dramatically lower than their expected ROI, ultimately steering bettors in the wrong direction. A big reason why we started Betscope is the frustration with existing tools purporting to have best-in-class analytics, but failing to execute on these concepts. We wouldn’t build and publish anything we wouldn’t use ourselves, and getting the math right on market evaluation is a necessary cornerstone for successful sports betting of any kind.